Introduction
Using debuggers in PHP is probably no unfamiliar territory for us developers, but do you know how to set-up Xdebug for your CLI script? Or perhaps you are experimenting with containers and resorted back to using the good old `dd()` or `var_dump()` because the extra twist in the Docker network made your old Xdebug configuration ineffective? No worries: We’ve hooked you up with a small handbook you can use in the most common PHP debugging situations this year.
When reading the chapters below, you’ll find that there is a recurring theme of “configuring the xdebug module”, “enabling your IDE to listen on the configured port” and “initiating a debug session”. This is because debugging actually isn’t that hard to configure and use once you get the hang of it. It mostly boils down to the same things over and over again, albeit in different scenario’s.
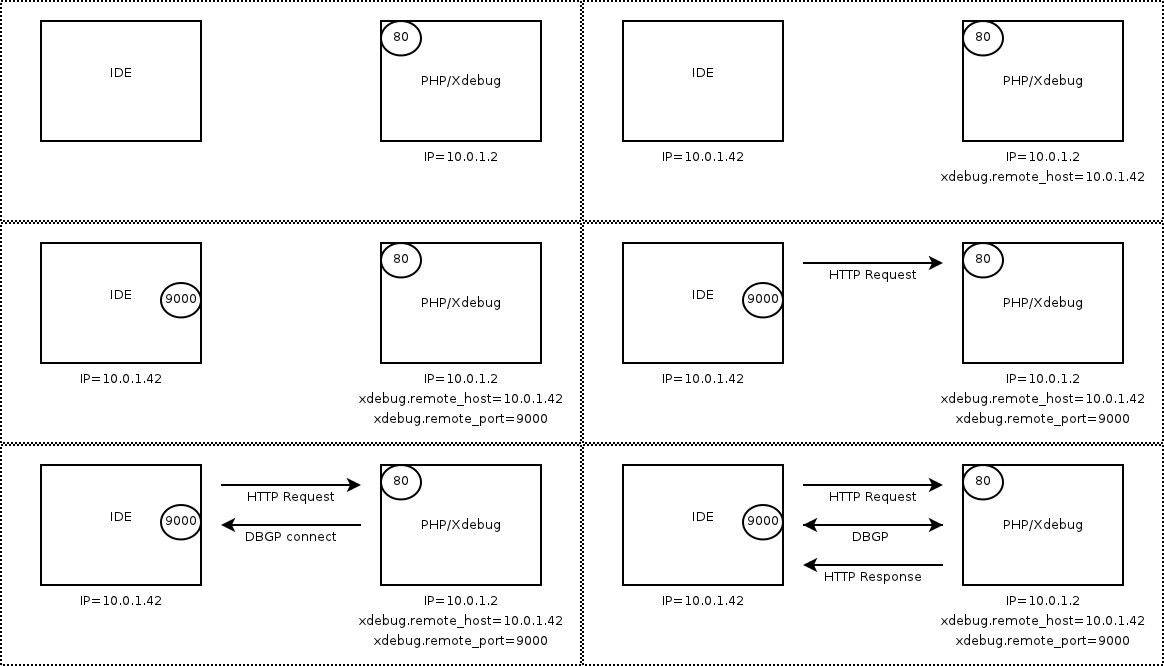
When you look at it, the concept of Xdebug is actually rather simple: whenever a PHP with Xdebug is triggered to start a session, Xdebug will send a initialization packet towards the configured remote_connect_back ip-address in the configuration. If the configured ip-address is listening for incoming debug connections it will respond with further commands to facilitate the debugging session.

Fun fact: your IDE sends simple ASCII commands whilst Xdebug responds with XML messages. You can read more about the commands and details of the inner workings of Xdebug in the Common Debugger Protocol (DBGp) docs.
(Y)our toolset
Should consist of a Xdebug helper button in your browser when debugging a web application. Get it here for Chrome and Firefox. Some people prefer bookmarks, that’s also fine. For everything else, we use PHPStorm as our IDE since it has both Xdebug and Zend debugger support built in.
As an added bonus, we’ll show you how to setup Visual Studio Code as well.
Of course other IDE’s are cool too (always try out new stuff!), but not covered in this article or experienced by us.
Path mapping in PHPStorm
Once you set up the server side, starting a debug session in PHPStorm has been made easy due to their Zero-configuration debug feature. All you have to do is click the “Start listening for connections” button.
We recommend that you enable Run > Break at fist line in PHP Scripts when setting up anything for the first time. This helps to configure the so-called path mappings for any new host.
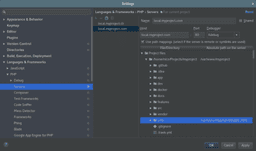
An example of a path mapping in a project is shown below:
If you ever need to manually revise these settings you can find them in File > Settings > Languages & Frameworks > PHP > Servers.
Path mapping in Visual Studio Code
After installing the php-debug extension for Visual Studio Code, the only thing we have to adjust is the path mapping.
Visual Studio Code does not offer an user interface for configuring your IDE settings. Instead you can edit the project configuration files located in your project root.
Here is what an example launch.json:
{
    "version": "0.2.0",
    "configurations": [
        {
            "name": "Listen for XDebug",
            "type": "php",
            "request": "launch",
            "port": 9000,
            "serverSourceRoot": "/var/www/myproject",
            "localSourceRoot": "/home/nico/Projects/myproject"
        },
        {
            "name": "Launch currently open script",
            "type": "php",
            "request": "launch",
            "program": "${file}",
            "cwd": "${fileDirname}",
            "port": 9000
        }
    ]
}
Running Xdebug in Vagrant boxes
At Enrise, we have been using a customized Vagrant box combined with Saltstack called the Enrise Basebox for our PHP projects in the last few years.
Since Vagrant takes care of setting up a development environment for us, and we like having our infrastructure as code, this Enrise basebox makes use of a Saltstack state such as the one below to install and configure Xdebug for us:
// file: debug.sls
php-xdebug:
  pkg.installed

/etc/php/7.1/fpm/conf.d/20-xdebug.ini:
  file.managed:
    - contents: |
        zend_extension=xdebug.so
        xdebug.remote_connect_back=0
        xdebug.remote_host=192.168.56.1
        xdebug.remote_enable=1
        xdebug.remote_port=9000
    - require:
      - pkg: php-xdebug
In any case, all you have to do is install Xdebug and assure you configuration is set to connect back to your host OS. If your Vagrant box somehow does not contain Xdebug you can use this one-line shell command to get you started (on a Debian / Ubuntu based Vagrant machine):
vagrant ssh -c "sudo apt install php-xdebug && printf 'zend_extension=xdebug.so\nxdebug.remote_connect_back=0\nxdebug.remote_host=192.168.56.1\nxdebug.remote_enable=1\nxdebug.remote_port=9000\n' | sudo tee /etc/php/*/mods-available/xdebug.ini && sudo phpenmod xdebug"
When using the Saltstack state mentioned above, make sure that the config paths and IP addresses are matching your setup. Finding the correct IP address in you vagrant box can be tricky. Every box we use has a private network in the 192.168.56.x range, making our host location predictable (192.168.56.1).
// file: Vagrantfile
config.vm.network 'private_network', ip: '192.168.56.100'
Web & API requests
Once your Xdebug extension is loaded and configured, debugging of your application should be as easy as:
- Opening PHPStorm in your project;
- Starting to listen for connections (and maybe toggling “break at first line on PHP scripts”);
- Enable debugging in your browser by using the debug helper, or adding ?XDEBUG_SESSION_START=PHPSTORM to your query string in case of an API;
- Refreshing your page;
Command line interface (CLI)
If you want to debug a console command you have to set two environment variables. See the example below how we usually invoke a debug session.
vagrant ssh -c "XDEBUG_CONFIG=\"idekey=PHPSTORM\" PHP_IDE_CONFIG=\"serverName=local.myproject.cli\" /vagrant/app/console my-app:my-command"
Xdebug config used for Vagrant boxes:
zend_extension=xdebug.so

xdebug.remote_enable=1
xdebug.remote_connect_back=0
xdebug.remote_host=192.168.56.1
xdebug.remote_port=9000
Running Xdebug in Docker containers
When talking about Docker containers, we mean the non virtualized implementation of Docker. Please see below for tips and tricks on virtualized Docker implementations like Windows (using HyperV) and Mac OS (using HyperKit), that emulate a near-native experience by deploying a Linux VM that in turn runs the Docker daemon.
Web & API requests
This works basically the same as debugging HTTP (web or API) on a Vagrant box, except that your own machine is now connected to a different network, managed by Docker instead of your Vagrant provider (Virtualbox, LibVirt).
Looking up what connect back IP address is needed, can be done by the first looking up what network your container is connected to with the command below.
docker inspect my_container | grep NetworkModeNow that we know the network, we can look up it’s gateway (which is your machine and thus the IP address we are looking for) with this command.
docker network inspect my_network | grep GateWayAs a double check, this is an IP that should exist as a network adapter on your machine, which you can check by typing ip a s and looking through the list of adapters for one with the IP you just found.
To ensure the same network subnet is used when destroying and recreating your container, you could use Docker-Compose with the following section added to the bottom:
networks:
  default:
    driver: bridge
    ipam:
      driver: default
      config:
      - subnet: 192.168.xx.0/24
        gateway: 192.168.xx.1
From here on out, it’s smooth sailing. Just update your container’s xdebug.conf, restart your container, and start debugging!
Command line interface (CLI)
With the steps explained above, we are already able to tell what the xdebug.remote_connect_back ip should be and how to apply it.
Once you have set that up , you can start debugging with Xdebug via the container’s CLI, like so (assuming your container holds your app on /app):
docker exec -ti \
  -e PHP_IDE_CONFIG="serverName=local.project.cli" \
  -e XDEBUG_CONFIG="idekey=PHPSTORM" \
  my_container php /app/index.php
Of course, when using Docker Compose, stuff gets a little bit easier. First you set your environment variables in your docker-compose.yml like so:
services:
  my_container:
    environment:
      PHP_IDE_CONFIG: serverName=local.project.cli
      XDEBUG_CONFIG: idekey=PHPSTORM
And now we don’t have to deal with all those environment variables anymore and it’s simply a matter of running the command below and off you go!
docker-compose exec my_container php /app/index.phpXdebug config used for Docker containers:
zend_extension=xdebug.so

xdebug.remote_enable=1
xdebug.remote_connect_back=0
xdebug.remote_host=<gateway_ip>
xdebug.remote_port=9000
Running Xdebug on a remote host
We’ve actually answered this question before. See this post for a pretty in-depth explanation on how to use a debugger on a acceptance / production environment.
Web & API Requests
The excerpt for Xdebug is as follows:
- Install the php-xdebug package on the server
- Make sure you only allow incoming connections from 127.0.0.1 at port 9000
- Open an SSH tunnel to the remote server using: ssh -R 9000:localhost:9000 user@remote.webserver.com
- Follow the four steps of “Running Xdebug in Vagrant”
The biggest task here is, once again, to set the correct Xdebug configuration.
By setting the remote host to localhost, we make use of the reverse SSH tunnel on port 9000 that we opened, so Xdebug on your server can connect to your local IDE.
Command line interface
The exact same setup can be used as for debugging web / API calls, we still want Xdebug to connect back to localhost on port 9000.
All we need is the reverse SSH tunnel to be open, but since you are already connected to the terminal via SSH, this should be easy 😉
Xdebug config used for remote servers:
zend_extension=xdebug.so

xdebug.remote_enable=1
xdebug.remote_connect_back=0
xdebug.remote_host=127.0.0.1
xdebug.remote_port=9000
Special occasions
Debugging unit-tests
This chapter is really short. Setting up and debugging unit tests is exactly the same as debugging CLI commands.
This means that you can simply follow the guide above for whatever platform you are debugging on, and when itś time to run the tests, you can simply replace php yourscript.php with php vendor/bin/phpunit and off you go. Happy debugging!
Docker on Mac OS
At the time of writing Docker on MacOS uses Hyperkit as a small VM to run the docker engine on. Due to this extra layer, setting up Xdebug on Docker for Mac OS requires a small workaround: There is a hostname available in each of your containers named the docker.for.mac.localhost. This hostname will resolve to your host OS.
Your xdebug configuration inside the container looks like this:
zend_extension=xdebug.so

xdebug.remote_enable=1
xdebug.remote_connect_back=0
xdebug.remote_host=docker.for.mac.localhost
xdebug.remote_port=9000
Docker on Windows
The Docker on Windows stack has roughly the same approach as Docker on OSX, with the only difference that Windows’s native HyperV virtual machine is used to run a small VM.
Being the same in nature as the OSX counterpart, naturally one would expect to have the same little hostname trick on Windows as well.
In this case you’re lucky, as the hostname docker.for.win.localhost is one of the new features introduced in Docker CE 17.06.0.
To sum it up, your xdebug configuration inside a container when running on Windows looks like this:
zend_extension=xdebug.so

xdebug.remote_enable=1
xdebug.remote_connect_back=0
xdebug.remote_host=docker.for.win.localhost
xdebug.remote_port=9000
Conclusion
There you go, most (if not all) situations developers could find themself in when trying to debug in a certain scenario. Bookmark this post so it acts as a quick reference guide whenever you need it!
Feel free to reach out to us if you know of a situation that’s lacking in this handbook, and we will do our best to extend the article to cover those cases as well.


