How remote debugging works
For a webserver serving PHP, the two most often used debuggers are Xdebug and Zend Debugger.
Setting up one of these might be a breeze on a local Vagrant environment or on the local network, but what if you wanted to look into the active code on a acceptance or production environment?
Even if stuff doesn’t break all the time in production (it really shouldn’t!) it might still be interesting to be able to e.g. play around with the profiler to further optimize your code.
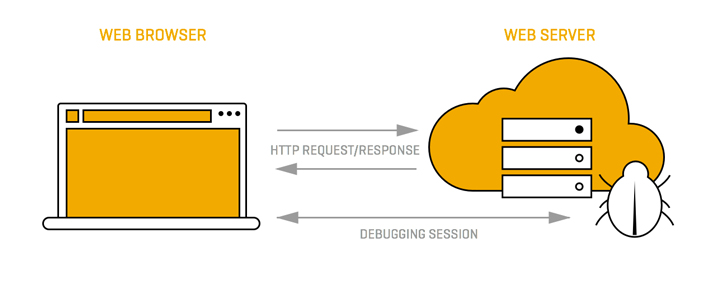
A remote PHP debugging session (when triggered from the web browser) works like this:

- The browser sends a HTTP request to the webserver running the debugger. This request contains a ‘I would like to debug this page’ kind of message.
- The debugger sees the request, and if the source is allowed connects to the specified host/port, where an IDE is set up to listen for this connection and start a debugging session.
- The IDE can now communicate with the debugger, and the developer can step through the code and inspect it.
- After we stepped through the last line of the code, the script’s output is returned to the browser, which was waiting for a response this whole time.
How remote debugging is set up
Connecting to a remote debugger normally requires us to set up the debugger so it knows who is allowed to connect (step 1), and if a connection is successful, where to connect back to (step 2).
Using Zend Debugger, things are set up like this:
- The IPs that are allowed to connect are configured on the server via, or if running Zend Server, via the Zend Server Administration Interface.
- Where to connect to is supplied in the HTTP request, using the debug_host and debug_port cookies.
Using XDebug, things are set up like this:
- The IP address that is allowed to connect is configured on the server using the value xdebug.remote_host
- Where to connect back to is magically configured using the same value. Connecting from 1.2.3.4 causes Xdebug to connect back on 1.2.3.4 on the defined port.
It is possible to set xdebug.remote_connect_back, but this generally speaking perceived as a very bad idea, since EVERYONE will be able to debug your PHP code, seeing private variables and worse!
The problem
The problem with these connections and configurations is twofold:
A) If a developer needs to connect from a new IP address, configuration changes must be made: in Zend Debugger the IP must be added to the whitelist and in Xdebug the configured IP must be changed
B) If the developer is behind a (corporate) router / firewall / NAT gateway of sorts, the debugger running on the webserver wil not be able to connect back to the listening IDE that’s running on the developer’s machine.
The solution
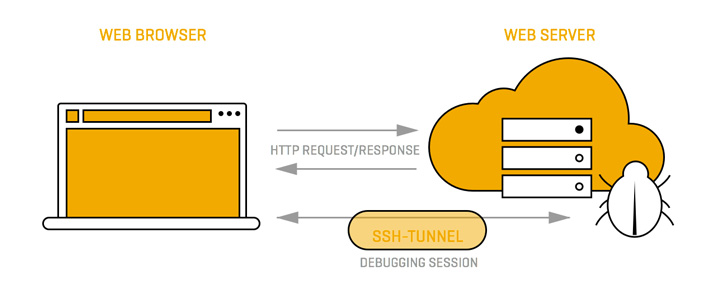
Luckily, the solution to all of these problems is a very simple one: we set up our favorite debugger to (only) allow 127.0.0.1 to start a debugging session.
Then we simply connect to the remote server using an SSH connection that sets up a remote tunnel:
$ ssh -R xxxx:localhost:xxxx user@remote.webserver.com
This remote tunnel forwards all traffic on the remote machine on port xxxx to the local machine on port xxxx, allowing the debugger to directly connect to our IDE.

Please keep in mind this debugger specific configuration:
- When using Xdebug, replace port xxxx with port 9000. Also, in the Xdebug config on the server, set xdebug.remote_host to 127.0.0.1 and make sure debug.remote_connect_back is disabled.
- When using the Zend Debugger, replace port xxxx with port 10137. Also make sure that the debug_cookie cookie is set to 127.0.0.1 (either via a bookmarklet or the Zend Studio toolbar)
Now fire up your browser and start debugging!

