

Enrise ♥ monitoring and automation. But if you combine those it’s even better!
Some time ago I wrote about Automated SSL monitoring with Low Level Discovery in Zabbix. We have been using this for quite some time now and it is still working beautifully. Over the past months we haven’t even touched the hosts’ configuration in Zabbix but were still able to monitor newly added SSL vhosts.
LLD is a very powerful tool which can be used for many things.
Moving parts and keeping an eye on them
There are many moving parts in a webapplication. Generally projects we build have several dependencies to services such as databases, queue’s or API’s. On servers we manage for our clients and ourselves we also check these services (e.g. in-depth MySQL and RabbitMQ monitoring) but if a service is running it doesn’t mean that the application can actually use it.
Even though our monitoring can indicate that MySQL is running and working perfectly the application could still have issues connecting to it. For this we have created special endpoints in the application which provides a textual representation of the global status (OK, FAILURE) and a more graphical page which shows the status for individual components.
In the past we have used Zabbix webchecks to verify that the word “OK” is mentioned on that page. If it is not, there is a problem with the application. But Zabbix didn’t know which problem that would be since it could not differentiate between the statuses easily. In such cases an engineer needed to look this up manually by going to the “advanced” status page displaying all components and the individual status. A step which is shouldn’t be necessary.
Add a little pinch of automation
This started as a little Friday afternoon research project but ended up as a very neat way of monitoring our applications in-depth.
For this we have created two new endpoints in the status part of the application. One endpoint who will provide a list of all components. This list is being used to feed the Low Level Discovery (LLD) part of Zabbix:
["api",
"filesystem",
"mysql",
"redis",
"rabbitmq",
"vpn",
"backup"
]
Once Zabbix receives the LLD data it will create items and triggers based on pre-configured protypes. In our case it creates an item and trigger for each component the application has indicated to contain.
The second part is the actual feed of the status for these components. For this another endpoint has been created which provides the status for the individual components:
{
  "api":{"statusCode":0,"status":"OK"},
  "filesystem":{"statusCode":0,"status":"OK"},
  "mysql":{"statusCode":0,"status":"OK"},
  "redis":{"statusCode":0,"status":"OK"},
  "rabbitmq":{"statusCode":0,"status":"OK"},
  "vpn":{"statusCode":0,"status":"OK"},
  "always-down":{"statusCode":1,"status":"FAILURE"}
}
With this in place, we should be able to get it into Zabbix. Or can we?
Unfortunately we discovered a few issues and limitations in Zabbix making it a bit more complex than we hoped for.
Working around Zabbix limitations
Our plan was to use an “External Check” for the discovery. However, we soon found out that it is not possible to create LLD keys with parameters. Feeding the data back into Zabbix requires us to also specify the same key as well but even if we do it fails to accept the data. This appears to be a known issue for which there is no fix available yet.
In order to work around this issue we switched to a trapper for the LLD. But then it raises the question: how do we feed this if we want to have this monitoring-initiated rather than application-initiated. A cron would work, but splits from Zabbix onto a separate system which requires maintenance and we would lose the ease of the interface in Zabbix to tweak polling times.
We ended up creating a normal item with type External Check. This one executes a Python script which uses the Zabbix Sender protocol to send the LLD data to Zabbix. We now have the data fed into Zabbix and it has created all items and triggers for the individual components.
For the status we could have created LLD-Prototype items that call a script to retrieve the JSON. But if the application would have 10 components to check this results in 10 individual HTTP requests. 10 requests, every 5 minutes means 120 requests an hour and 2880 per 24 hours. A bit much, especially if some calls can be pretty heavy on the server (due to connections to external parties).
We could have made it “smart” by caching the results for the first run and use these for the subsequent requests. But that would allow for a component to go bad between the first and last runs, which we would then overlook. Instead, we used the same approach as we did for the LLD: an External Check as normal item and Zabbix Sender protocol.
The result? Only 1 request every 2 minutes to retrieve the status for batch of checks. Sweet!
The result
In the end, the resulting setup looks like this:
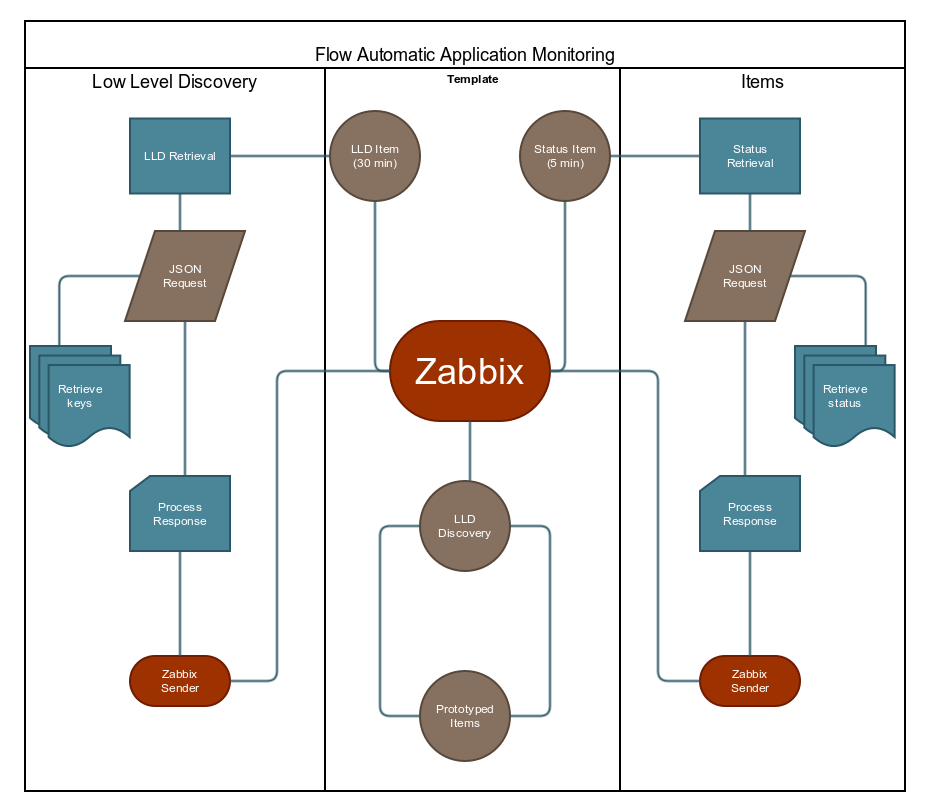
After a period of testing we can now say that this is the way forward when it comes to automating monitoring of individual application components.
Since Enrise ♥ Opensource it has been made available on GitHub for anyone to use!
Check it out at https://github.com/Enrise/Zabbix-AppMonitor!
